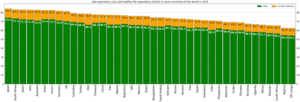
Subtopic 1: Prefectures with Highest Life Expectancy
– Nagano: 84.72
– Shiga: 84.68
– Fukui: 84.41
– Kyoto: 84.38
– Kumamoto: 84.36
Subtopic 2: Prefectures with Lowest Life Expectancy
– Aomori: 82.30
– Akita: 82.95
– Iwate: 83.15
– Tochigi: 83.17
– Wakayama: 83.21
Subtopic 3: Life Expectancy Disparities by Gender
– Men: 80.77
– Women: 87.01
– Largest Difference: 6.24 (Hokkaido)
– Smallest Difference: 6.03 (Kanagawa)
– National Average: 83.89
Subtopic 4: Regional Variations in Life Expectancy
– Highest: Nagano
– Lowest: Aomori
– Kanto Region: 83.94 (Chiba)
– Kansai Region: 83.48 (Osaka)
– Okinawa: 83.86
Subtopic 5: Data Sources and References
– Ministry of Health, Labour and Welfare
– Publication Year: 2015
– Access Date: 2019-04-19
– Detailed Statistics: mhlw.go.jp
– Related Media: Wikimedia Commons
This article needs to be updated. (January 2022) |
This is a list of Japanese prefectures by life expectancy.


the Our World in Data


