**Charts:**
– Development of life expectancy in Australia according to estimation of the World Bank Group
– Life expectancy with calculated sex gap
– Life expectancy in Australia according to estimation of Our World in Data
– Development of life expectancy in Australia in comparison to some countries of South-East Asia and Oceania
– Life expectancy and healthy life expectancy in Australia on the background of other countries of the world in 2019
**See also:**
– Wikimedia Commons has media related to Life expectancy charts for Australia
– List of countries by life expectancy
– List of Oceanian countries by life expectancy
– States and territories of Australia
– Demographics of Australia
**References:**
– Life expectancy, 2020 – 2022. Australian Bureau of Statistics. 8 November 2023. Retrieved 5 April 2024
– Life expectancy at birth, total – Australia. World Bank Group
– Life expectancy at birth: Australia. Our World in Data
– Life expectancy and Healthy life expectancy, data by country. World Health Organization. 2020. Retrieved 1 February 2024
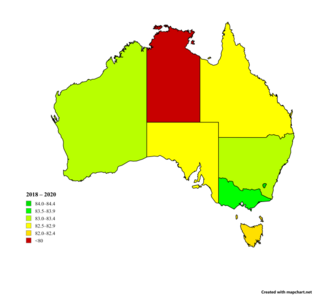
This is a list of Australian states and territories by estimated life expectancy at birth.
| state | 2018–2020 | change | 2019–2021 | change | 2020–2022 | total change | |||||||||
|---|---|---|---|---|---|---|---|---|---|---|---|---|---|---|---|
| overall | male | female | F Δ M | overall | male | female | F Δ M | overall | male | female | F Δ M | ||||
| Australia | 83.2 | 81.2 | 85.3 | 4.1 | 0.1 | 83.3 | 81.3 | 85.4 | 4.1 | −0.1 | 83.2 | 81.2 | 85.3 | 4.1 | 0.0 |
| Capital Territory | 84.0 | 82.1 | 85.9 | 3.8 | 0.5 | 84.5 | 82.7 | 86.3 | 3.6 | −0.4 | 84.1 | 82.2 | 86.0 | 3.8 | 0.1 |
| Western Australia | 83.4 | 81.3 | 85.7 | 4.4 | 0.4 | 83.8 | 81.7 | 85.9 | 4.2 | −0.1 | 83.7 | 81.7 | 85.8 | 4.1 | 0.3 |
| Victoria | 83.8 | 81.9 | 85.8 | 3.9 | −0.1 | 83.7 | 81.7 | 85.7 | 4.0 | −0.2 | 83.5 | 81.6 | 85.5 | 3.9 | −0.3 |
| New South Wales | 83.3 | 81.2 | 85.4 | 4.2 | 0.0 | 83.3 | 81.4 | 85.4 | 4.0 | 0.0 | 83.3 | 81.3 | 85.3 | 4.0 | 0.0 |
| South Australia | 82.9 | 80.7 | 85.2 | 4.5 | 0.2 | 83.1 | 81.0 | 85.3 | 4.3 | −0.1 | 83.0 | 81.0 | 85.1 | 4.1 | 0.1 |
| Queensland | 82.8 | 80.6 | 85.1 | 4.5 | 0.1 | 82.9 | 80.9 | 85.1 | 4.2 | −0.1 | 82.8 | 80.7 | 85.0 | 4.3 | 0.0 |
| Tasmania | 82.0 | 79.9 | 84.3 | 4.4 | 0.3 | 82.3 | 80.3 | 84.4 | 4.1 | 0.0 | 82.3 | 80.3 | 84.3 | 4.0 | 0.3 |
| Northern Territory | 78.5 | 76.2 | 81.0 | 4.8 | 0.1 | 78.6 | 76.3 | 81.0 | 4.7 | −0.2 | 78.4 | 76.2 | 80.7 | 4.5 | −0.1 |
Data source: Australian Bureau of Statistics. The next release is expected 8 November 2024.


